Results Summary: Diagram
This documentation goes over the Diagram in the Results Summary tab.
1. Access Results Summary Tab
-
Navigate to the Results Summary tab to view the summary diagram of the turning movements from your study.
-
The tab displays a graphical representation of turning movements at the study location, categorized by road user type and turning movement from each approach.
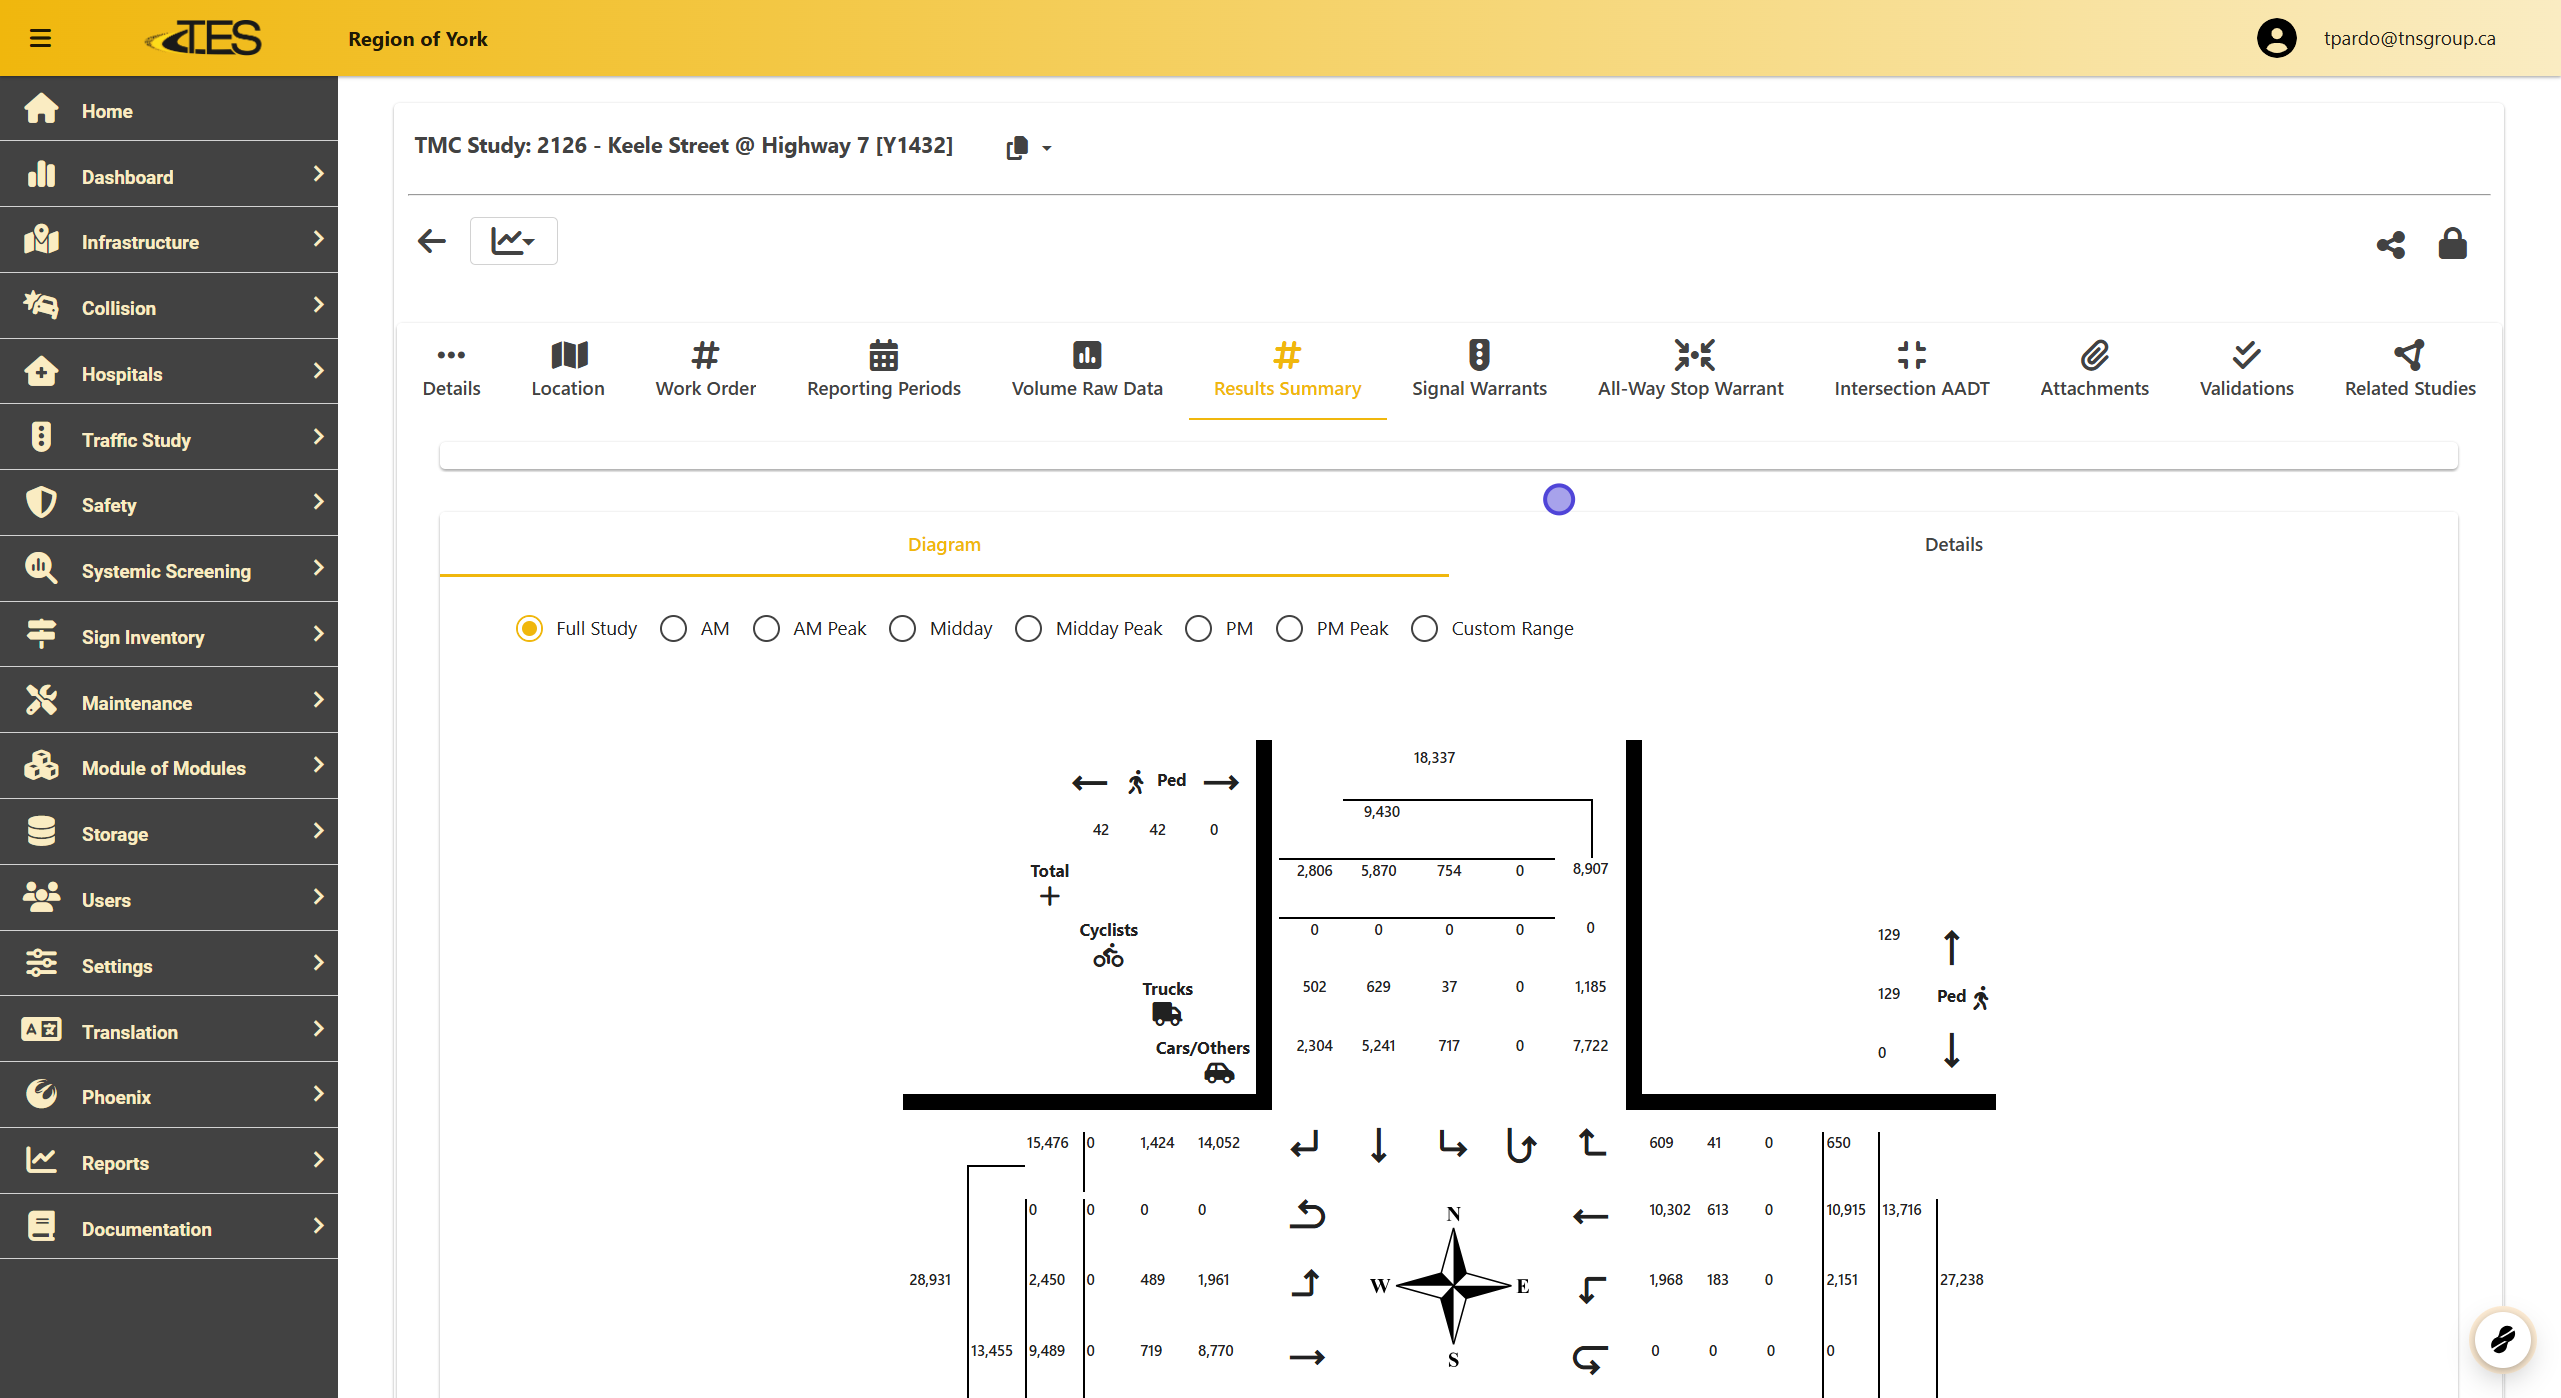
2. The Results Summary Diagram
-
The diagram represents the shape of the location being studied, including the turning movements from each approach for various road user types.
-
Each value corresponds to road user types and turning movements, showing how much each group contributed to specific movements.

3. Hovering Over Values in the Diagram
Hover over a number in the diagram to highlight:
-
The corresponding road users.
-
Turning movements related to the value.
-
Other summed values, if applicable.
-
With this example:
-
the highlighted value is the sum of all westbound Cars/Others.
-
This means that the Cars/Others symbol will be highlighted along with the west approach U-turn value, the south approach right turn value, the east approach straight forward value, and the north approach right turn value.
-

4. Hovering Over Symbols
Hover over symbols (e.g., cyclists, trucks, cars) to highlight corresponding turning movements and associated values.

5. Pedestrians
Pedestrian data includes:
-
Volumes for going left, right, and the total (center value).
-
If specific directions are unavailable, all counted pedestrians are included in one of the direction values.

6. Periods
-
Click on different periods to change the volume displayed
-
Options for periods include AM , AM Peak , Midday , Midday Peak , PM , and PM Peak .
-
Default: Full Study (all volume data collected during the study).
-
For multi-day studies, you can select a specific day to display data.

7. Custom Range
-
Select Custom Range to define a specific time range for displayed data:
-
Enter the start time and end time .
-
Ensure the end time corresponds to the final interval to include the desired data (e.g., for 8:00 AM to 9:00 AM, set start to 8:00 AM and end to 8:45 AM).
-
-
Data is presented in 15-minute intervals, similar to volume raw data.
